Tracker
Overlay
Shows or hides the live overlay. Hiding it does not stop tracking.
RevitPulse runs quietly in the background, records how you work in Revit and shows it back to you: live in a small overlay, and as daily, monthly and all-time stats.
This overlay is a live simulation with sample data.
RevitPulse adds its own RevitPulse tab. Tracking does not depend on any of these buttons; they only show you what has already been recorded.
Shows or hides the live overlay. Hiding it does not stop tracking.
Opens the stats window with Day, Month and All time views.
Opens the folder with your log files in File Explorer.
Opens settings.json: daily goal, idle threshold and overlay options.
A small floating panel that stays above the Revit window (not above other apps) and updates every second. It only reads numbers from the tracker, so it costs Revit nothing. The tour below walks through each part; hover a row to jump to it.
TRACKING while you work. It switches to IDLE after 45 seconds without any action.
Today's active time against your daily goal, 4 hours by default. It turns green when you reach it and keeps counting past 100%.
The big clock. Time you were actually working today, across all Revit sessions.
How long Revit has been open today, and how long the current Revit launch has been running.
Every command that changed the model (each Revit transaction counts once).
Elements added, modified and deleted. Hover the number to see the split.
Edits divided by active hours: how intense today's work has been.
Straight from Revit events. Warnings are the ones Revit raised today.
The project and the view you are working in right now.
Edits per minute over the last hour, with the peak minute on the right.
Days in a row with at least 5 minutes of active time, and your best day for edits. It shows NEW PR when you beat it.
Lifetime edits and active hours, and the last command you ran.
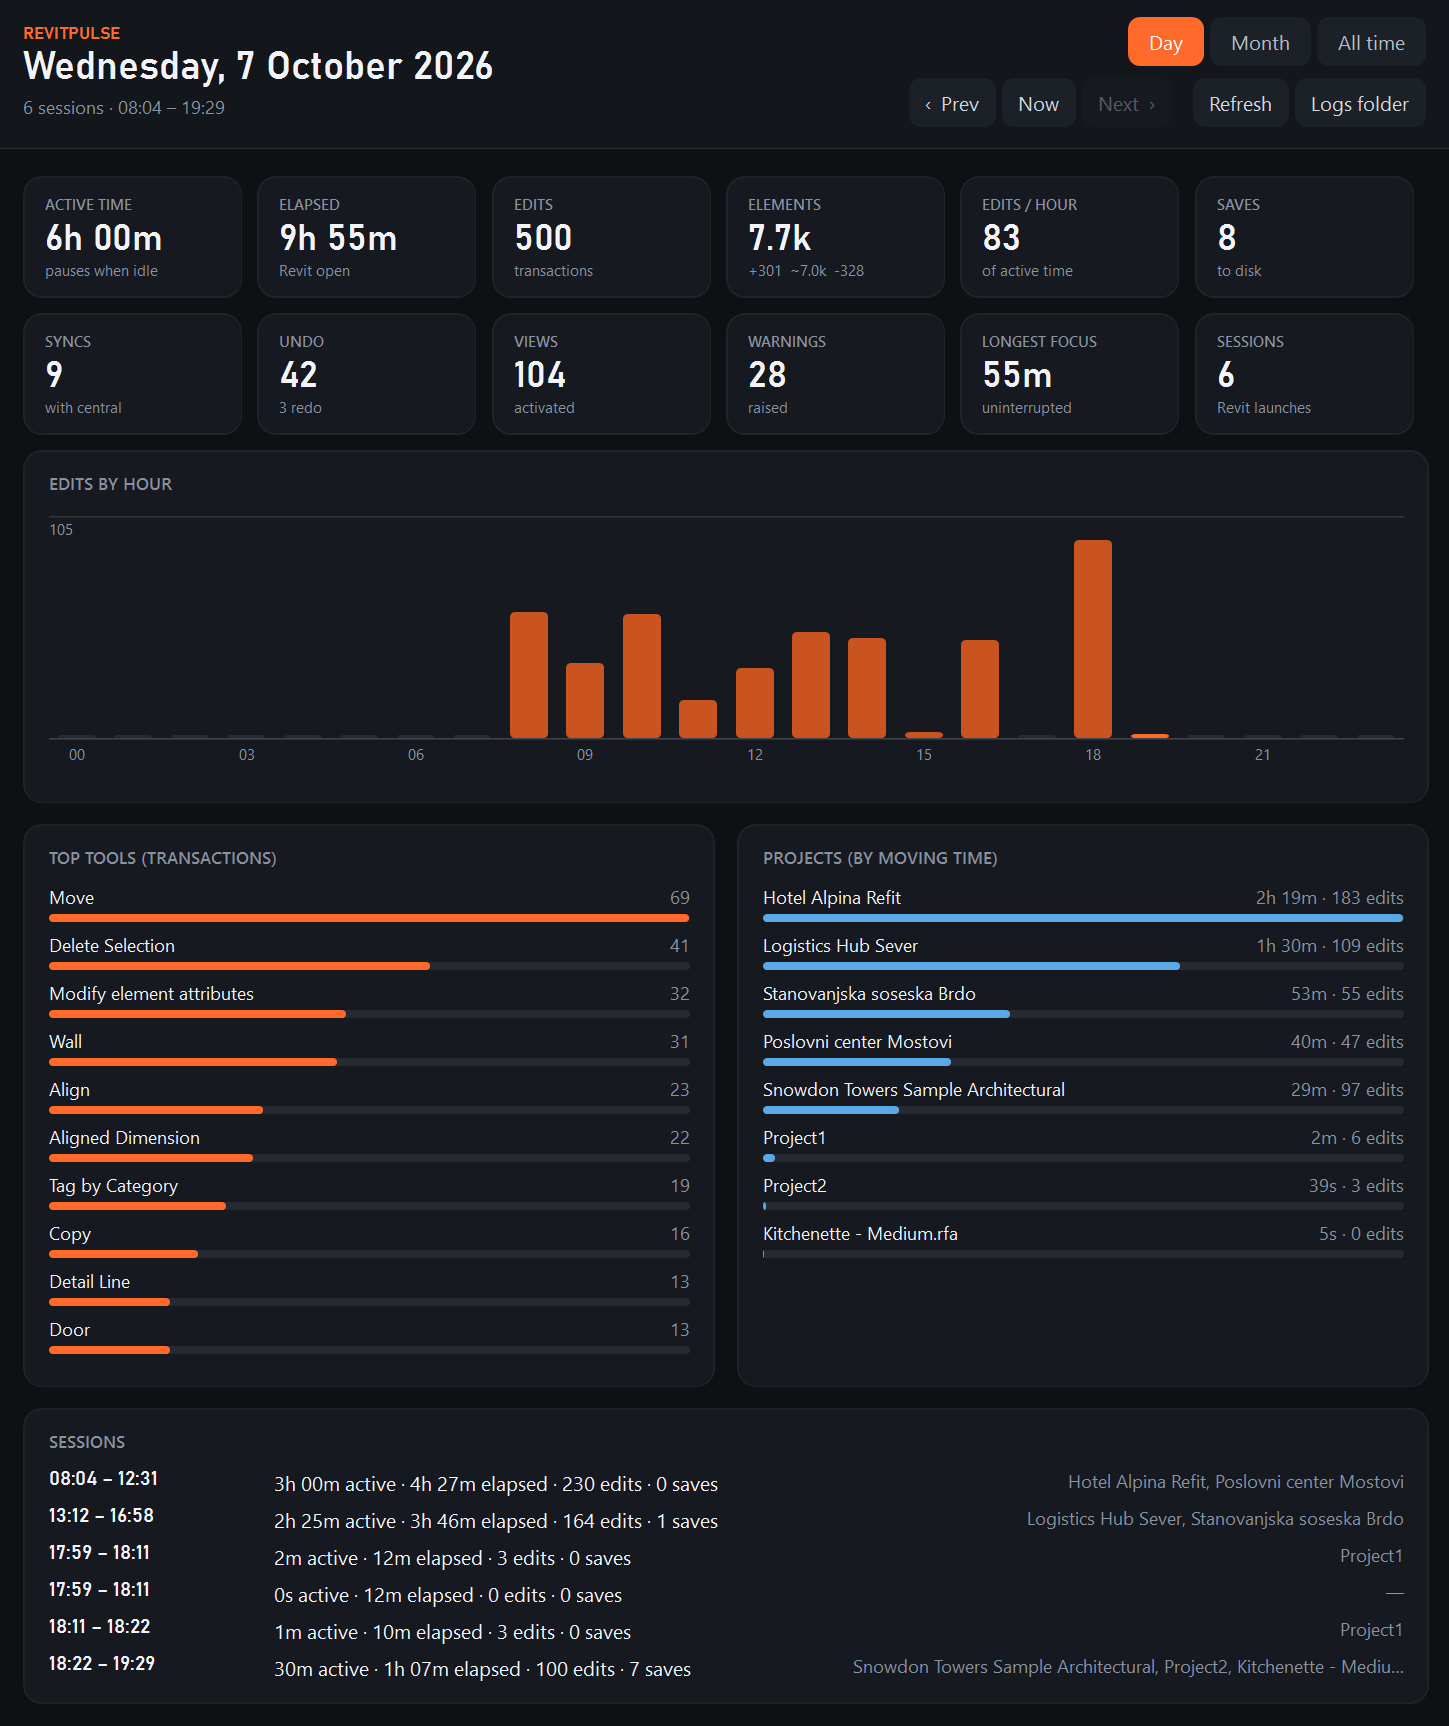
Built from the local log files every time you open it or press Refresh. Use Prev, Now and Next to move between days or months.
Totals for the day, edits by hour, top tools, projects by active time, and every Revit session with its start and end time.
Active minutes per day, active days, average per active day, edits by hour of day, and the month's records.
Hours per month, when you work by hour and weekday, current and longest streak, and personal records.
Revit open over lunch is not work. RevitPulse looks at the gaps between your actions (edits, view switches, selections, saves) and decides which gaps to count.
A gap between two actions shorter than 3 minutes counts in full. Thinking and looking at the model is work.
A longer gap counts only its first 45 seconds. The overlay switches to IDLE at that point.
Both numbers are adjustable in settings.json as idle_seconds and grace_seconds.
RevitPulse listens to standard Revit API events. It never opens a transaction and never writes to your model.
| Revit event | What RevitPulse records |
|---|---|
| DocumentChanged | Edits, elements added / modified / deleted, undo and redo, the command name, and which project it happened in. |
| DocumentSaved, SavedAs | Saves to disk. |
| SynchronizedWithCentral | Syncs with central on workshared models. |
| DocumentOpened, Closing | Opened documents; the log is written to disk on close. |
| ViewActivated | View switches and the name of the current view. |
| SelectionChanged | Selections, used only to detect activity. Revit 2023 and newer. |
| FailuresProcessing | Number of warnings Revit raised. |
| ApplicationClosing | Final write when Revit closes. |
Everything is stored inside the extension folder. Nothing is sent anywhere. Back the folder up, open it in Excel or delete it whenever you like.
%APPDATA%\RevitPulse\logs.RevitPulse.extension\logs\ ├─ settings.json goal, idle threshold, overlay ├─ daily\ │ └─ 2026-10\ │ └─ 2026-10-07__081203_4120.json one session ├─ events\ │ └─ 2026-10\ │ └─ 2026-10-07__081203_4120.csv opens in Excel └─ errors.log only if something fails
2d129321…bd6e
Unzip RevitPulse-1.1.0.zip and put the RevitPulse.extension folder into a pyRevit extensions folder, for example %APPDATA%\pyRevit\Extensions or a folder of your own such as C:\RevitPlugin.
Use pyRevit ▸ Reload, or restart Revit. If you use a custom folder, add it under pyRevit ▸ Settings ▸ Custom Extension Directories first.
Tracking starts on its own. Click Overlay on the RevitPulse tab whenever you want to see it live.
Requires pyRevit with the default IronPython engine. Tested on Revit 2025 and newer (.NET 8); selection tracking needs Revit 2023+. If two Revit windows are open at the same time, elapsed time is currently counted for both. A fix is planned.